from:China Electricity Councildate:2020-07-21
From January to June, the electricity consumption of the whole society continued to revive, with positive growth in the primary industry and the residential electricity consumption. The year-on-year growth of the electricity consumption in 18 provinces exceeded the national average. The decline rate of cumulative electricity consumption of the industry and the manufacturing industry continued to narrow. The electricity consumption of the four energy-intensive industries all achieved positive growth in June.
1. Electricity consumption of the whole society
From January to June, the nationwide electricity consumption was 3354.7 TWh, a decrease of 1.3% year-on-year. Among them, the nationwide electricity consumption in June was 635.0 TWh, an increase of 6.1% year-on-year.
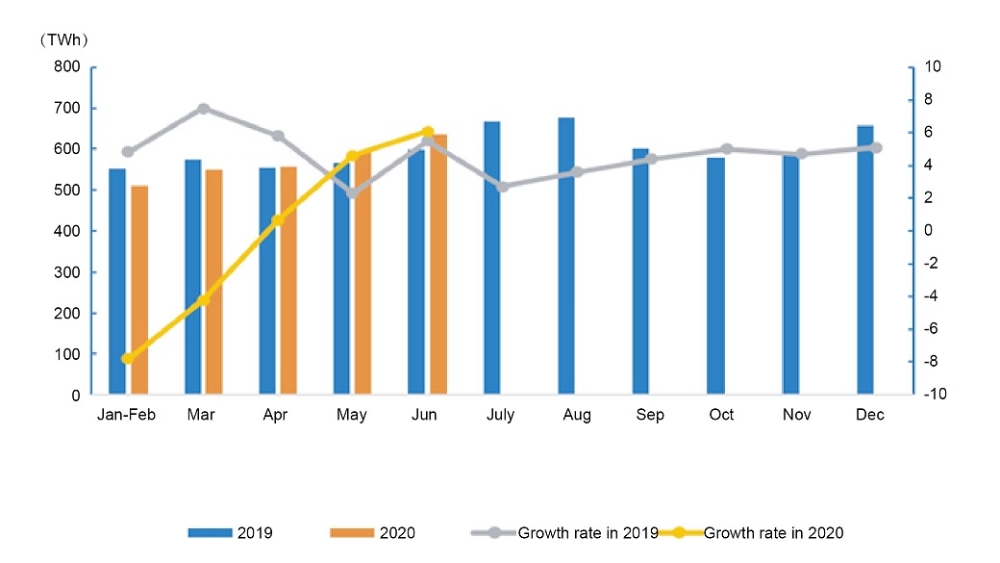
By sectors, from January to June, the electricity consumption of the primary industry was 37.3 TWh, an increase of 8.2% year-on-year; the electricity consumption of the second industry was 2251.0 TWh, a year-on-year decrease of 2.5%; and the electricity consumption of the tertiary industry was 533.3 TWh, a year-on-year decrease of 4.0%; and that of residential was 533.1 TWh, with a year-on-year increase of 6.6%.
In June, the electricity consumption of the primary, secondary and tertiary industries increased by 12.9%, 4.3% and 7.0% year-on-year respectively; and the residential electricity consumption increased by 14.3% year-on-year.
2. Electricity consumption by regions
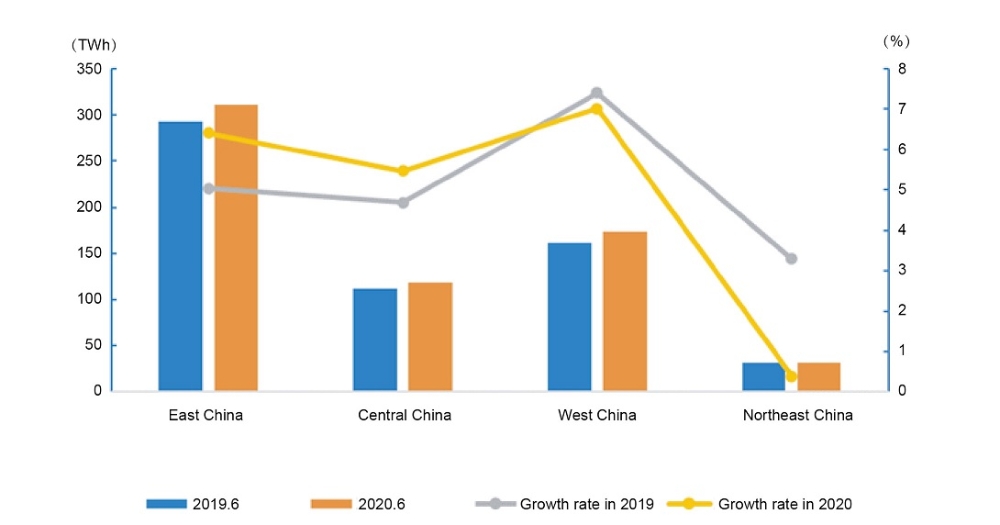
From January to June, the electricity consumption of the Eastern, Central, Western and Northeast China was 1548.5 TWh, 627.8 TWh, 975.5 TWh and 202.9 TWh respectively, with year-on-year growth rates of - 3.1%, - 3.0%, 2.9% and - 0.5% respectively.
In June, the growth rates of the electricity consumption in the Eastern, Central, Western and Northeast regions were 6.4%, 5.5%, 7.0% and 0.4% respectively, which were 2.1, 0.1, 1.2 and 2.0 percentage points higher than those of the previous month respectively.
From January to June, the year-on-year growth of electricity consumption in 18 provinces exceeded the national average, Namely, Yunnan (7.8%), Xinjiang (6.1%), Inner Mongolia (5.6%), Gansu (5.5%), Guangxi (3.9%), Tibet (3.4%), Sichuan (2.4%), Jiangxi (1.6%), Jilin (1.5%), Qinghai (1.1%), Anhui (0.1%), Heilongjiang (0.04%), Guizhou (0.0%), Hunan (- 0.1%), Fujian (- 0.7%), Shaanxi (- 1.0%), Shanxi (- 1.2%) and Chongqing (-1.3%).
In June, the growth rate of the electricity consumption in 17 provinces exceeded the national average, namely, Jiangxi (16.1%), Zhejiang (14.1%), Tibet (13.7%), Fujian (12.8%), Guangxi (10.9%), Sichuan (9.9%), Yunnan (9.8%), Xinjiang (9.7%), Shanghai (9.5%), Gansu (9.3%), Hunan (9.0%), Inner Mongolia (8.7%), Anhui (8.3%), Guangdong (7.6%), Jiangsu (7.3%), Chongqing (6.9%) and Hainan (6.3%). There are 5 provinces with a negative growth rate of electricity consumption, of which Ningxia (- 13.7%) has a growth rate less than -5%.
3. Electricity consumption in industry and manufacturing
From January to June, the national industrial electricity consumption was 2211.6 TWh, a year-on-year decrease of 2.4%, and the growth rate fell by 5.3 percentage points over the same period of the previous year, accounting for 65.9% of the total electricity consumption. In June, the national industrial electricity consumption was 433.4 TWh, an increase of 4.2% year-on-year, and the growth rate fell by 0.6 percentage points from the same period of the previous year, accounting for 68.2% of the total electricity consumption.
From January to June, the electricity consumption of the manufacturing industry was 1666.0 TWh, a year-on-year decrease of 3.0%, and the growth rate fell by 6.4 percentage points over the same period of the previous year. Among them, the electricity consumption of the four energy-intensive industries totaled 947.2 TWh, a decrease of 1.0% year-on-year, and the growth rate fell by 4.4 percentage points from the same period of the previous year. The electricity consumption of the high-tech and equipment manufacturing industry was 330.7 TWh, a decrease of 4.4 year-on-year %, and the growth rate fell by 7.9 percentage points from the same period of the previous year. The electricity consumption of consumer goods manufacturing industry was 210.8 TWh, a decrease of 9.4% year-on-year, and the growth rate fell by 11.5 percentage points from the same period of the previous year. The electricity consumption of other manufacturing industries was 177.3 TWh, a year-on-year decrease of 2.5%, and the growth rate dropped by 7.5 percentage points over the same period of the previous year.
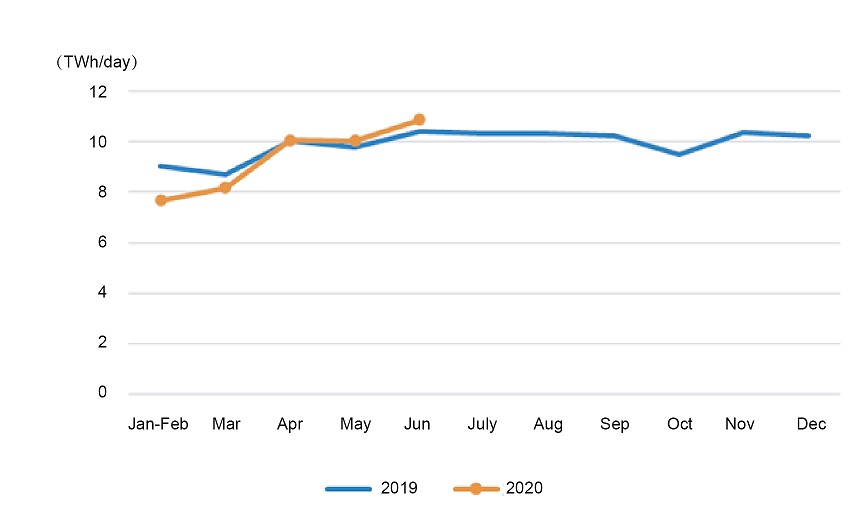
In June, the electricity consumption of the manufacturing industry was 326.0 TWh, an increase of 4.7% year-on-year, and the growth rate was 0.6 percentage points higher than the same period of the previous year. The average daily electricity consumption of the manufacturing industry was 10.87 TWh, an increase of 0.45 TWh from the same period of the previous year, and an increase of 0.82 TWh from the previous month. Among them, the electricity consumption of the four energy-intensive industries totaled 179.0 TWh, an increase of 3.9% year-on-year, and the growth rate fell by 1.4 percentage points from the same period of the previous year. The electricity consumption of the high-tech and equipment manufacturing industry was 69.2 TWh, an increase of 8.4% year-on-year, and the growth rate was 5.7 percentage points higher than the same period of the previous year. The electricity consumption of consumer goods manufacturing industry was 43.2 TWh, an increase of 2.0% year-on-year, and an increase of 1.1 percentage points from the same period of the previous year. The electricity consumption of other manufacturing industries was 34.5 TWh, a year-on-year increase 5.4%, and an increase of 0.6 percentage points over the same period of the previous year.
4. Electricity consumption in energy-intensive industries
From January to June, the electricity consumption of the chemical industry was 213.5 TWh, a decrease of 3.2% year-on-year, and the growth rate fell by 4.5 percentage points from the same period of the previous year. The electricity consumption of the building materials industry was 162.9 TWh, a decrease of 4.4% year-on-year, and the growth rate dropped by 10.5 percentage points from the same period of the previous year. The electricity consumption of the ferrous metal smelting and refining industry was 275.4 TWh, a decrease of 0.4% year-on-year, and the growth rate was 6.3 percentage points lower than the same period of the previous year. The electricity consumption of the non-ferrous metal smelting and refining industry was 295.4 TWh, an increase of 2.1% year-on-year, and the increase rate was 0.9 percentage points higher than the same period of the previous year.
In June, the electricity consumption of the chemical industry was 38.2 TWh, an increase of 1.8% year-on-year, and the growth rate was 1.0 percentage points higher than the same period of the previous year. The electricity consumption of the building materials industry was 37.0 TWh, an increase of 8.0% year-on-year, and the growth rate was 1.1 percentage points higher than the same period of the previous year The electricity consumption of the ferrous metal smelting and rfining industry was 52.3 TWh, an increase of 4.0% year-on-year, and the growth rate fell by 8.5 percentage points over the same period of the previous year. The electricity consumption of the non-ferrous metal smelting and refining industry was 51.5 TWh, an increase of 2.6% year-on-year, and the growth rate was 1.4 percentage points higher than the same period of the previous year.
Tel:+86-25-84152563
Fax:+86-25-52146294
Email:export@hbtianrui.com
Address:Head Office: No.8 Chuangye Avenue, Economic Development Zone, Tianmen City, Hubei Province, China (Zip Code: 431700) Nanjing Office: Building 23, Baijiahu Science and Technology Industrial Park, No.2 Qingshuiting West Road, Jiangning Economic Development Zone, Nanjing City, Jiangsu Province,China (Zip Code:211106)