from:China Electricity Councildate:2020-08-25
From January to July, the decrease of the electricity consumption of the whole society continued to slow down, with positive growth in the primary industry and the residential domestic electricity consumption. The year-on-year growth of the electricity consumption in 18 provinces exceeded the national average. The cumulative electricity consumption of the industry and the manufacturing industry saw negative growth. The electricity consumption of the ferrous and nonferrous metal industry achieved positive growth in July.
1、 Electricity consumption of the whole society
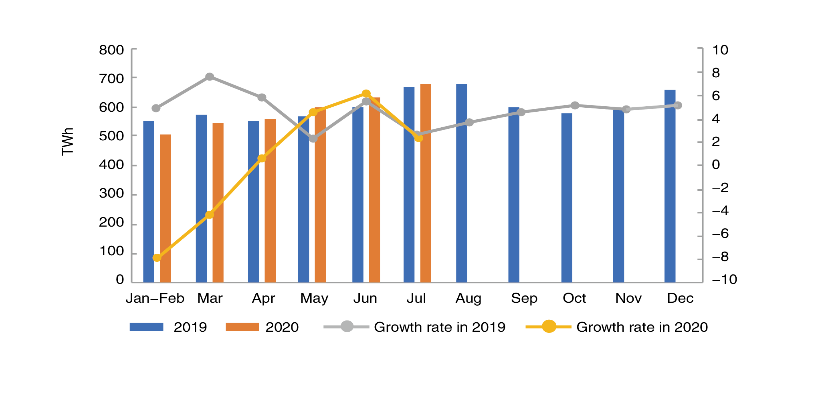
From January to July, the nationwide electricity consumption was 4038.1 TWh, a decrease of 0.7% year-on-year. Among them, the nationwide electricity consumption in July was 682.4 TWh, an increase of 2.3% year-on-year.
By sectors, from January to July, the electricity consumption of the primary industry was 45.8 TWh, an increase of 8.8% year-on-year; the electricity consumption of the secondary industry was 2711.1 TWh, a year-on-year decrease of 2.1%; and the electricity consumption of the tertiary industry was 649.8 TWh, a year-on-year decrease of 2.5%; and that of residential was 631.4 TWh, with a year-on-year increase of 7.6%.
In July, the electricity consumption of the primary, secondary and tertiary industries increased by 11.6%, -0.7% and 5.3% year-on-year respectively; and the residential electricity consumption increased by 13.8% year-on-year.
2. Electricity consumption by regions
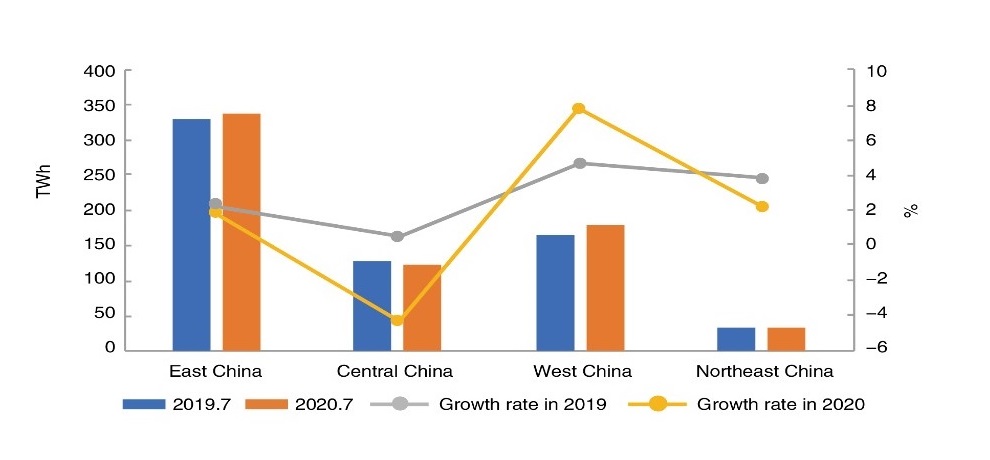
From January to July, the electricity consumption of the Eastern, Central, Western and Northeast China was 1888.1 TWh, 752.8 TWh, 1158.3TWh and 238.9TWh respectively, with year-on-year growth rates of – 2.2%, - 3.2%, 3.7% and - 0.1% respectively.
In July, the growth rates of the electricity consumption in the Eastern, Central, Western and Northeast regions were 2.0%, -4.1%, 7.8% and 2.4% respectively, among which the growth rates of Eastern and Central regions were 4.4 and 9.6 percentage points lower than those of the previous month respectively, while the growth rates of Western and Northeast regions were 0.8 and 2.0 percentage points higher than those of the previous month respectively.
From January to July, the year-on-year growth of electricity consumption in 18 provinces exceeded the national average, Namely, Yunnan (8.2%), Inner Mongolia (6.3%), Gansu (6.1%), Guangxi (5.7%), Xinjiang (5.4%),Tibet (4.6%), Sichuan (4.5%), Jiangxi (3.8%), Jilin (2.2%), Qinghai (2.0%), Fujian (1.5%), Guizhou (0.9%), Guangdong (0.7%), Heilongjiang (0.6%), Hunan (0.4%), Hainan (0.1%), Shaanxi (- 0.4%) and Chongqing (-0.5%).
In July, the growth rate of the electricity consumption in 17 provinces exceeded the national average, namely, Sichuan (16.3%), Jiangxi (15.1%), Guangxi (14.6%), Guangdong (12.4%), Tibet (11.8%), Fujian (11.5%), Inner Mongolia (10.3%), Yunnan (10.3%), Gansu (9.8%), Hainan (8.5%), Qinghai(8.1%), Zhejiang (7.8%), Jilin(6.3%), Heilongjiang (4.1%), Chongqing (3.3%), Shaanxi (2.9%) and Hunan (2.7%). There are 11 provinces with a negative growth rate of electricity consumption, of which Henan (- 11.7%) and Beijing (-11.3%) has a growth rate less than -10%.
3、 Electricity consumption in industry and manufacturing
From January to July, the national industrial electricity consumption was 2663.2 TWh, a year-on-year decrease of 2.1%, and the growth rate fell by 4.7 percentage points over the same period of the previous year, accounting for 66% of the total electricity consumption. In July, the national industrial electricity consumption was 450.8 TWh, a decrease of 0.9% year-on-year, and the growth rate fell by 1.9 percentage points from the same period of the previous year, accounting for 66.0% of the total electricity consumption.
From January to July, the electricity consumption of the manufacturing industry was 1999.3 TWh, a year-on-year decrease of 1.9%, and the growth rate fell by 5.4 percentage points over the same period of the previous year. Among them, the electricity consumption of the four energy-intensive industries totaled 1124.4 TWh, a decrease of 0.4% year-on-year, and the growth rate fell by 4.0 percentage points from the same period of the previous year. The electricity consumption of the high-tech and equipment manufacturing industry was 404.6 TWh, a decrease of 2.5% year-on-year, and the growth rate fell by 6.0 percentage points from the same period of the previous year. The electricity consumption of consumer goods manufacturing industry was 256.7 TWh, a decrease of 7.4% year-on-year, and the growth rate fell by 9.3 percentage points from the same period of the previous year. The electricity consumption of other manufacturing industries was 213.6 TWh, a year-on-year decrease of 1.2%, and the growth rate dropped by 7.0 percentage points over the same period of the previous year.
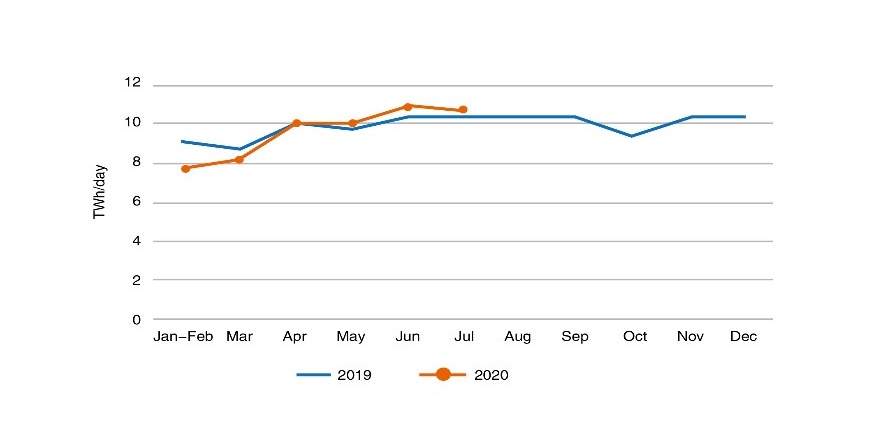
In July, the electricity consumption of the manufacturing industry was 332.4 TWh, an increase of 4.1% year-on-year, and the growth rate was 0.3 percentage points lower than the same period of the previous year. The average daily electricity consumption of the manufacturing industry was 10.72 TWh, an increase of 0.42 TWh from the same period of the previous year, and a decrease of 0.14 TWh from the previous month. Among them, the electricity consumption of the four energy-intensive industries totaled 176.5 TWh, an increase of 3.0% year-on-year, and the growth rate fell by 1.9 percentage points from the same period of the previous year. The electricity consumption of the high-tech and equipment manufacturing industry was 73.8 TWh, an increase of 6.8% year-on-year, and the growth rate was 3.4 percentage points higher than the same period of the previous year. The electricity consumption of consumer goods manufacturing industry was 45.9 TWh, an increase of 3.1% year-on-year, and an increase of 2.4 percentage points from the same period of the previous year. The electricity consumption of other manufacturing industries was 36.2 TWh, a year-on-year increase 5.0%, and a decrease of 2.9 percentage points over the same period of the previous year.
4. Electricity consumption in energy-intensive industries
From January to July, the electricity consumption of the chemical industry was 252.4 TWh, a decrease of 2.8% year-on-year, and the growth rate fell by 4.6 percentage points from the same period of the previous year. The electricity consumption of the building materials industry was 198.6 TWh, a decrease of 2.4% year-on-year, and the growth rate dropped by 8.3 percentage points from the same period of the previous year. The electricity consumption of the ferrous metal smelting and refining industry was 327.2 TWh, an increase of 0.3% year-on-year, and the growth rate was 6.2 percentage points lower than the same period of the previous year. The electricity consumption of the non-ferrous metal smelting and refining industry was 346.2 TWh, an increase of 2.0% year-on-year, and the increase rate was 1.0 percentage points higher than the same period of the previous year.
In July, the electricity consumption of the chemical industry was 38.9 TWh, decrease of 0.3% year-on-year, and the growth rate was 6.2 percentage points lower than the same period of the previous year. The electricity consumption of the building materials industry was 35.4 TWh, an increase of 7.6% year-on-year, and the growth rate was 2.8 percentage points higher than the same period of the previous year. The electricity consumption of the ferrous metal smelting and refining industry was 51.8 TWh, an increase of 4.3% year-on-year, and the growth rate fell by 5.8 percentage points over the same period of the previous year. The electricity consumption of the non-ferrous metal smelting and refining industry was 50.4 TWh, an increase of 1.4% year-on-year, and the growth rate was 1.6 percentage points higher than the same period of the previous year.
Tel:+86-25-84152563
Fax:+86-25-52146294
Email:export@hbtianrui.com
Address:Head Office: No.8 Chuangye Avenue, Economic Development Zone, Tianmen City, Hubei Province, China (Zip Code: 431700) Nanjing Office: Building 23, Baijiahu Science and Technology Industrial Park, No.2 Qingshuiting West Road, Jiangning Economic Development Zone, Nanjing City, Jiangsu Province,China (Zip Code:211106)