from:China Electricity Councildate:2020-09-27
From January to August, the electricity consumption of the whole society achieved positive growth for the first time in this year, with continued slowing down of the decrease in the second industry and the tertiary industry electricity consumption. The year-on-year growth of the electricity consumption in 18 provinces exceeded the national average. The average daily electricity consumption of the manufacturing industry hits a record high. The electricity consumption of the ferrous and nonferrous metal industry kept positive growth in August.
1、 Electricity consumption of the whole society
From January to August, the nationwide electricity consumption was 4767.6 TWh, an increase of 0.5% year-on-year. Among them, the nationwide electricity consumption in August was 729.4TWh, an increase of 7.7% year-on-year.
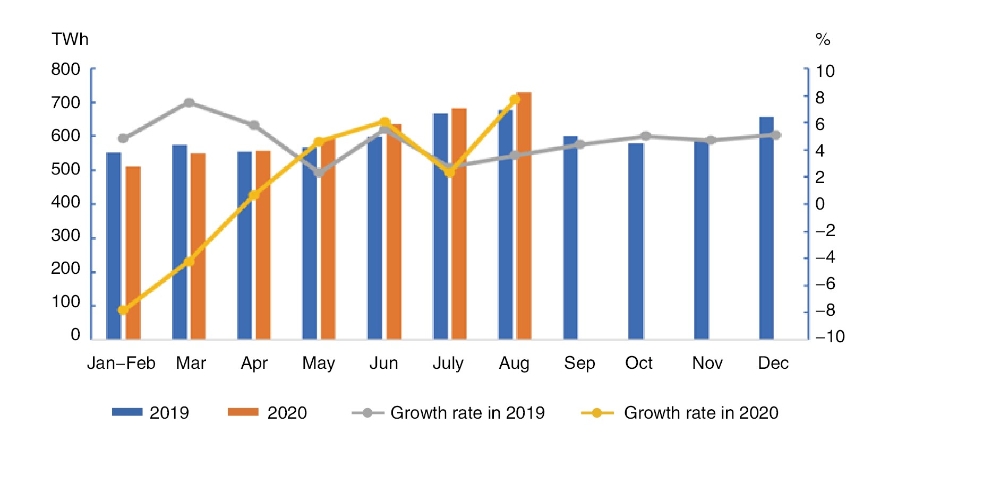
By sectors, from January to August, the electricity consumption of the primary industry was 55.2 TWh, an increase of 9.4% year-on-year; the electricity consumption of the secondary industry was 3191.4 TWh, a year-on-year decrease of 0.5%; and the electricity consumption of the tertiary industry was 781.2 TWh, a year-on-year decrease of 1.0%; and that of residential was 739.9TWh, with a year-on-year increase of 6.3%.
In August, the electricity consumption of the primary, secondary and tertiary industries increased by 12.1%, 9.9% and 7.5% year-on-year respectively; and the residential electricity consumption decreased by 1.2% year-on-year.
2. Electricity consumption by regions
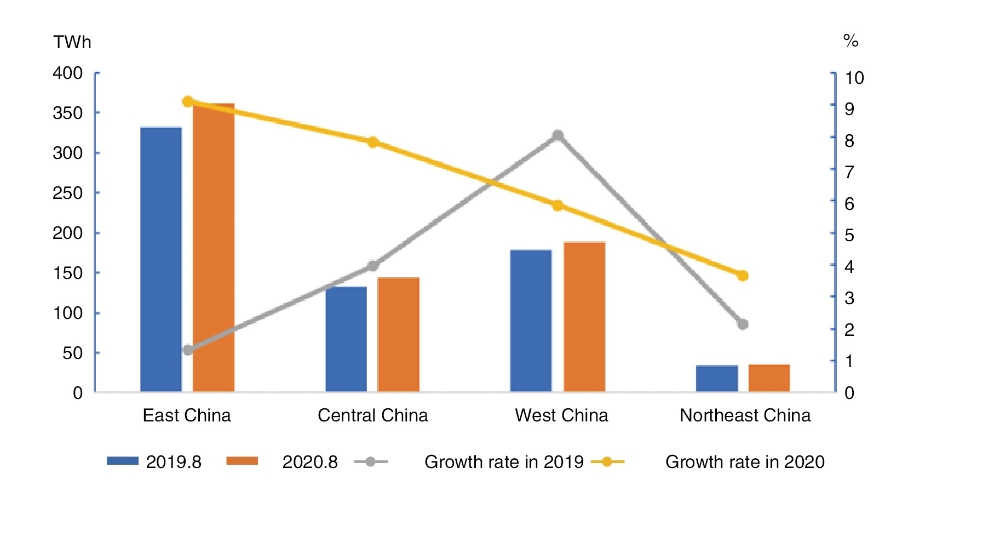
From January to August, the electricity consumption of the Eastern, Central, Western and Northeast China was 2249.8 TWh, 896.2 TWh, 1347.3 TWh and 274.3TWh respectively, with year-on-year growth rates of – 0.6%, - 1.6%, 4.0% and 0.4% respectively.
In August, the growth rates of the electricity consumption in the Eastern, Central, Western and Northeast regions were 9.1%, 7.8%, 5.9% and 3.7% respectively, among which the growth rates of Eastern, Central and Northeast regions were 7.1, 11.9 and 1.2 percentage points higher than those of the previous month respectively, while the growth rates of the Western region was 1.9 percentage points lower than that of the previous month.
From January to August, the year-on-year growth of electricity consumption in 18 provinces exceeded the national average, Namely, Yunnan (9.0 %), Gansu (6.7%), Inner Mongolia (6.4%), Guangxi (5.6%), Tibet (5.3%), Sichuan (4.9%), Jiangxi (4.4%), Xinjiang (4.2%), Qinghai (2.6%), Jilin (2.3%),Fujian (2.1%), Guizhou (1.4%), Guangdong (1.3%), Anhui (1.3%), Heilongjiang (1.1%), Hunan (1.1%), Chongqing (1.0%) and Hainan (0.7%).
In August, the growth rate of the electricity consumption in 12 provinces exceeded the national average, namely, Anhui (16.1%), Yunnan (13.5%), Zhejiang (13.1%), Jiangsu (13.1%), Shandong (11.8%), Shanghai (10.5%), Gansu (10.4%), Tibet (10.3%), Tianjin (9.7%), Chongqing (8.5%), Hainan (8.1%) and Jiangxi (7.8%). There are 2 provinces with a negative growth rate of electricity consumption, namely, Xinjiang (-3.5%) and Ningxia (-2.7%).
3、 Electricity consumption in industry and manufacturing
From January to August, the national industrial electricity consumption was 3133.9 TWh, a year-on-year decrease of 0.5%, and the growth rate fell by 3.2 percentage points over the same period of the previous year, accounting for 65.7% of the total electricity consumption. In August, the national industrial electricity consumption was 470.9 TWh, an increase of 9.9% year-on-year, and the growth rate increase by 5.8 percentage points from the same period of the previous year, accounting for 64.6% of the total electricity consumption.
From January to August, the electricity consumption of the manufacturing industry was 2349.8 TWh, a year-on-year decrease of 0.3%, and the growth rate fell by 3.7 percentage points over the same period of the previous year. Among them, the electricity consumption of the four energy-intensive industries totaled 1310.2 TWh, an increase of 0.8% year-on-year, and the growth rate fell by 2.5 percentage points from the same period of the previous year. The electricity consumption of the high-tech and equipment manufacturing industry was 482.7 TWh, a decrease of 0.2% year-on-year, and the growth rate fell by 3.6 percentage points from the same period of the previous year. The electricity consumption of consumer goods manufacturing industry was 305.0 TWh, a decrease of 5.6% year-on-year, and the growth rate fell by 7.3 percentage points from the same period of the previous year. The electricity consumption of other manufacturing industries was 251.9 TWh, a year-on-year increase of 0.3%, and the growth rate dropped by 5.7 percentage points over the same period of the previous year.
In August, the electricity consumption of the manufacturing industry was 351.0 TWh, an increase of 9.7% year-on-year, and the growth rate was 7.4 percentage points higher than the same period of the previous year. The average daily electricity consumption of the manufacturing industry was 11.32 TWh, an increase of 0.99 TWh from the same period of the previous year, and an increase of 0.6 TWh from the previous month. Among them, the electricity consumption of the four energy-intensive industries totaled 186.2 TWh, an increase of 9.2% year-on-year, and the growth rate increase by 7.2 percentage points from the same period of the previous year. The electricity consumption of the high-tech and equipment manufacturing industry was 78.2 TWh, an increase of 13.8% year-on-year, and the growth rate was 11.5 percentage points higher than the same period of the previous year. The electricity consumption of consumer goods manufacturing industry was 48.4 TWh, an increase of 5.6% year-on-year, and an increase of 5.3 percentage points from the same period of the previous year. The electricity consumption of other manufacturing industries was 38.3 TWh, a year-on-year increase 9.4%, and an increase of 2.3 percentage points over the same period of the previous year.

4. Electricity consumption in energy-intensive industries
From January to August, the electricity consumption of the chemical industry was 293.3 TWh, a decrease of 1.3% year-on-year, and the growth rate fell by 2.4 percentage points from the same period of the previous year. The electricity consumption of the building materials industry was 236.0 TWh, a decrease of 0.4% year-on-year, and the growth rate dropped by 6.3 percentage points from the same period of the previous year. The electricity consumption of the ferrous metal smelting and refining industry was 381.2 TWh, an increase of 1.3% year-on-year, and the growth rate was 4.8 percentage points lower than the same period of the previous year. The electricity consumption of the non-ferrous metal smelting and refining industry was 399.8 TWh, an increase of 2.8% year-on-year, and the increase rate was 1.8 percentage points higher than the same period of the previous year.
In August, the electricity consumption of the chemical industry was 41.0 TWh, an increase of 9.5% year-on-year, and the growth rate was 11.5 percentage points higher than the same period of the previous year. The electricity consumption of the building materials industry was 37.4 TWh, an increase of 11.2% year-on-year, and the growth rate was 8.1 percentage points higher than the same period of the previous year. The electricity consumption of the ferrous metal smelting and refining industry was 54.4 TWh, an increase of 8.9% year-on-year, and the growth rate increase by 4.0 percentage points over the same period of the previous year. The electricity consumption of the non-ferrous metal smelting and refining industry was 53.4 TWh, an increase of 7.9% year-on-year, and the growth rate was 6.5 percentage points higher than the same period of the previous year.
Tel:+86-25-84152563
Fax:+86-25-52146294
Email:export@hbtianrui.com
Address:Head Office: No.8 Chuangye Avenue, Economic Development Zone, Tianmen City, Hubei Province, China (Zip Code: 431700) Nanjing Office: Building 23, Baijiahu Science and Technology Industrial Park, No.2 Qingshuiting West Road, Jiangning Economic Development Zone, Nanjing City, Jiangsu Province,China (Zip Code:211106)