from:China Electricity Councildate:2020-10-30
From January to September, the electricity consumption of the whole society increased year-on-year, with the electricity consumption growth of the secondary industry changed from negative to positive. The year-on-year growth of the electricity consumption in 17 provinces exceeded the national average. The electricity consumption of the industry and manufacturing industry achieved positive growth for the first time in this year. Except for the chemical industry, the other three energy-intensive industries have a positive growth in electricity consumption.
1. Electricity consumption of the whole society
From January to September, the nationwide electricity consumption was 5413.4TWh, an increase of 1.3% year-on-year. Among them, the nationwide electricity consumption in September was 645.4 TWh, an increase of 7.2% year-on-year.
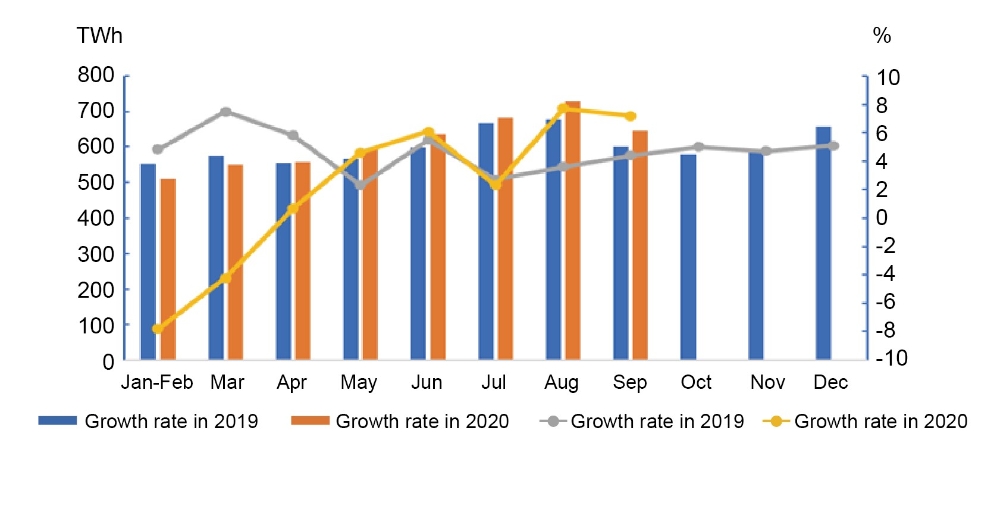
By sectors, from January to August, the electricity consumption of the primary industry was 63.7TWh, an increase of 9.6% year-on-year; the electricity consumption of the secondary industry was 3602.5 TWh, a year-on-year increase of 0.5%; and the electricity consumption of the tertiary industry was 897.5 TWh, a year-on-year decrease of 0.2%; and that of residential was 849.8 TWh, with a year-on-year increase of 6.0%.
In September, the electricity consumption of the primary, secondary and tertiary industries increased by 11.6%, 8.6% and 5.1% year-on-year respectively; and the residential electricity consumption increased by 4.0% year-on-year.
2. Electricity consumption by regions
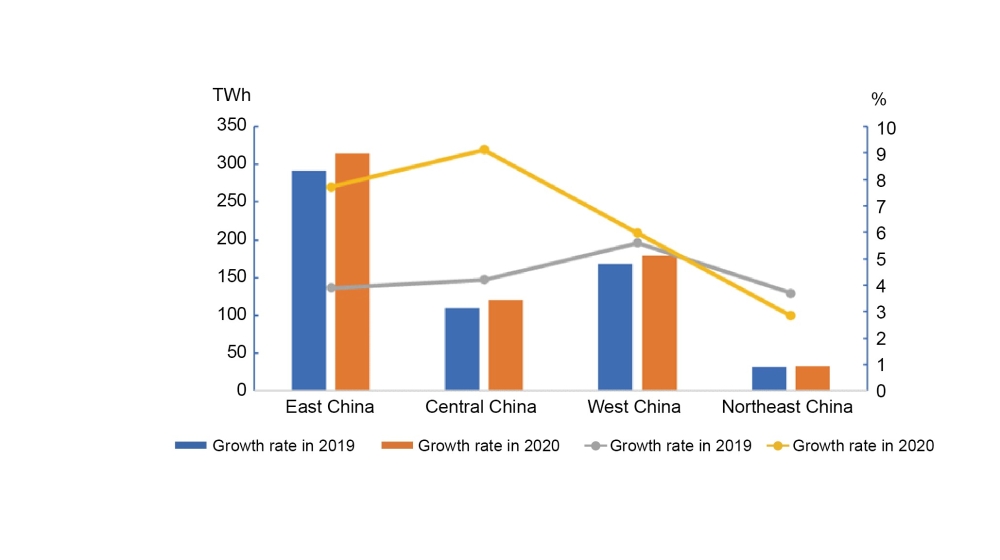
From January to September, the electricity consumption of the Eastern, Central, Western and Northeast China was 2563.6 TWh, 1016.3 TWh, 1526.2 TWh and 307.3 TWh respectively, with year-on-year growth rates of 0.4%, - 0.4%, 4.2% and 0.6% respectively.
In September, the growth rates of the electricity consumption in the Eastern, Central, Western and Northeast regions were 7.7%, 9.1%, 6.0% and 2.9% respectively, among which the growth rates of Central and Western regions were 1.3 and 0.1 percentage points higher than those of the previous month respectively, while the growth rates of Eastern and Northeast regions were 1.4 and 0.8 percentage points lower than those of the previous month respectively.
 From January to September, the year-on-year growth of electricity consumption in 17 provinces exceeded the national average, Namely, Yunnan (9.3%), Gansu (6.6%), Inner Mongolia (6.2%), Sichuan (5.7%), Guangxi (5.7%), Tibet (5.6%), Jiangxi (4.3%), Xinjiang (4.2%), Anhui (2.7%), Qinghai (2.6%), Jilin(2.6%), Guangdong(2.3%), Hainan(2.2%), Fujian(2.2%), Guizhou(1.7%), Hunan (1.7%), Shaanxi (1.4%).
In September, the growth rate of the electricity consumption in 12 provinces exceeded the national average, namely, Henan(15.7%), Anhui (14.5%), Hainan (13.7%), Shanxi (11.2%), Yunnan (11.2%), Sichuan (11.1%), Shandong (10.2%), Guangdong (9.7%), Shaanxi (9.5%), Jiangsu (9.0%), Tibet (8.0%), Hebei (7.9%). There are 3 provinces with a negative growth rate of electricity consumption, of which Beijing (-3.7%), Ningxia (-3.5%) and Hubei (-0.02%).
3. Electricity consumption in industry and manufacturing
From January to September, the national industrial electricity consumption was 3536.5 TWh, a year-on-year increase of 0.5%, and the growth rate fell by 2.3 percentage points over the same period of the previous year, accounting for 65.3% of the total electricity consumption. In September, the national industrial electricity consumption was 402.3 TWh, an increase of 8.7% year-on-year, and the growth rate increase by 5.3 percentage points from the same period of the previous year, accounting for 62.3% of the total electricity consumption.
From January to September, the electricity consumption of the manufacturing industry was 2683.7 TWh, a year-on-year increase of 0.7%, and the growth rate fell by 2.5 percentage points over the same period of the previous year. Among them, the electricity consumption of the four energy-intensive industries totaled 1490.3 TWh, an increase of 1.7% year-on-year, and the growth rate fell by 1.1 percentage points from the same period of the previous year. The electricity consumption of the high-tech and equipment manufacturing industry was 553.5 TWh, an increase of 1.1% year-on-year, and the growth rate fell by 2.3 percentage points from the same period of the previous year. The electricity consumption of consumer goods manufacturing industry was 351.6 TWh, a decrease of 4.3% year-on-year, and the growth rate fell by 6.3 percentage points from the same period of the previous year. The electricity consumption of other manufacturing industries was 288.3 TWh, a year-on-year increase of 1.3%, and the growth rate dropped by 4.8 percentage points over the same period of the previous year.
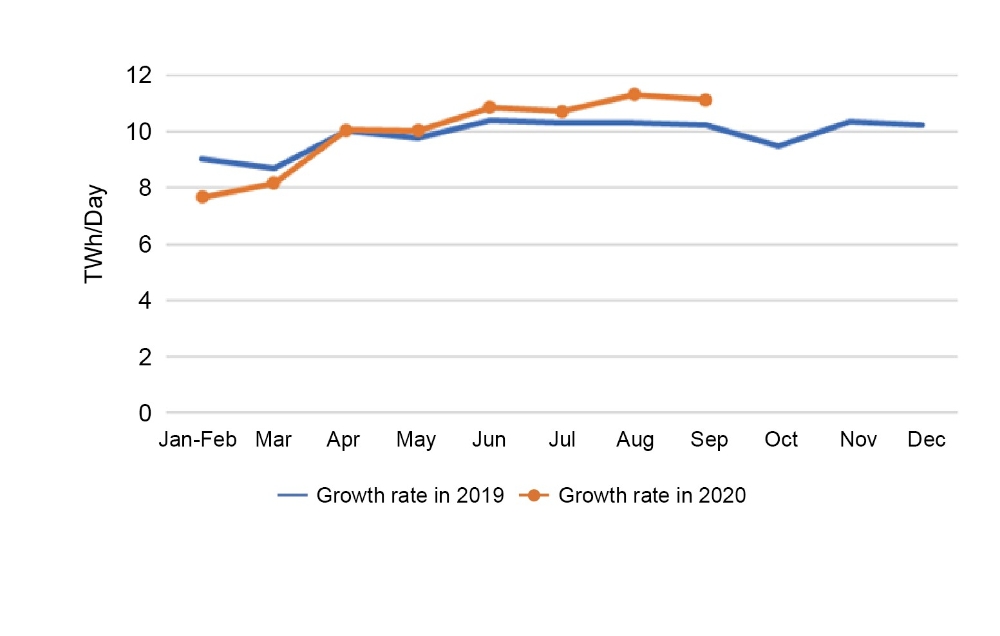
In September, the electricity consumption of the manufacturing industry was 333.9 TWh, an increase of 8.9% year-on-year, and the growth rate was 6.6 percentage points higher than the same period of the previous year. The average daily electricity consumption of the manufacturing industry was 11.13 TWh, an increase of 0.91 TWh from the same period of the previous year, and a decrease of 0.19 TWh from the previous month. Among them, the electricity consumption of the four energy-intensive industries totaled 180.0 TWh, an increase of 8.8% year-on-year, and the growth rate increased by 8.7 percentage points from the same period of the previous year. The electricity consumption of the high-tech and equipment manufacturing industry was 70.8 TWh, an increase of 11.8% year-on-year, and the growth rate was 7.4 percentage points higher than the same period of the previous year. The electricity consumption of consumer goods manufacturing industry was 46.6 TWh, an increase of 4.9% year-on-year, and an increase of 0.9 percentage points from the same period of the previous year. The electricity consumption of other manufacturing industries was 36.4TWh, a year-on-year increase 9.2%, and an increase of 2.1 percentage points over the same period of the previous year.
4. Electricity consumption in energy-intensive industries
From January to September, the electricity consumption of the chemical industry was 331.4 TWh, a decrease of 0.6% year-on-year, and the growth rate fell by 1.5 percentage points from the same period of the previous year. The electricity consumption of the building materials industry was 272.8 TWh, an increase of 0.9% year-on-year, and the growth rate dropped by 4.9 percentage points from the same period of the previous year. The electricity consumption of the ferrous metal smelting and refining industry was 432.9 TWh, an increase of 2.2% year-on-year, and the growth rate was 3.5 percentage points lower than the same period of the previous year. The electricity consumption of the non-ferrous metal smelting and refining industry was 453.1 TWh, an increase of 3.4% year-on-year, and the increase rate was 3.6 percentage points higher than the same period of the previous year.
In September, the electricity consumption of the chemical industry was 38.1 TWh, an increase of 5.2% year-on-year, and the growth rate was 6.1 percentage points higher than the same period of the previous year. The electricity consumption of the building materials industry was 36.8 TWh, an increase of 10.3% year-on-year, and the growth rate was 5.0 percentage points higher than the same period of the previous year. The electricity consumption of the ferrous metal smelting and refining industry was 51.8 TWh, an increase of 8.9% year-on-year, and the growth rate increase by 6.2 percentage points over the same period of the previous year. The electricity consumption of the non-ferrous metal smelting and refining industry was 53.3 TWh, an increase of 10.3% year-on-year, and the growth rate was 15.1 percentage points higher than the same period of the previous year.
Tel:+86-25-84152563
Fax:+86-25-52146294
Email:export@hbtianrui.com
Address:Head Office: No.8 Chuangye Avenue, Economic Development Zone, Tianmen City, Hubei Province, China (Zip Code: 431700) Nanjing Office: Building 23, Baijiahu Science and Technology Industrial Park, No.2 Qingshuiting West Road, Jiangning Economic Development Zone, Nanjing City, Jiangsu Province,China (Zip Code:211106)