from:China Electricity Councildate:2020-11-25
From January to October, the electricity consumption of the whole society increased year-on-year, with the electricity consumption growth of the tertiary industry changed from negative to positive. The year-on-year growth of the electricity consumption in 16 provinces exceeded the national average. The electricity consumption of the industry and manufacturing industry maintained steady growth, with growth rates lower than that of national average. The four energy-intensive industries have a positive growth in electricity consumption.
1、 Electricity consumption of the whole society
From January to October, the nationwide electricity consumption was 6030.6TWh, an increase of 1.8% year-on-year. Among them, the nationwide electricity consumption in October was 617.2 TWh, an increase of 6.6% year-on-year.
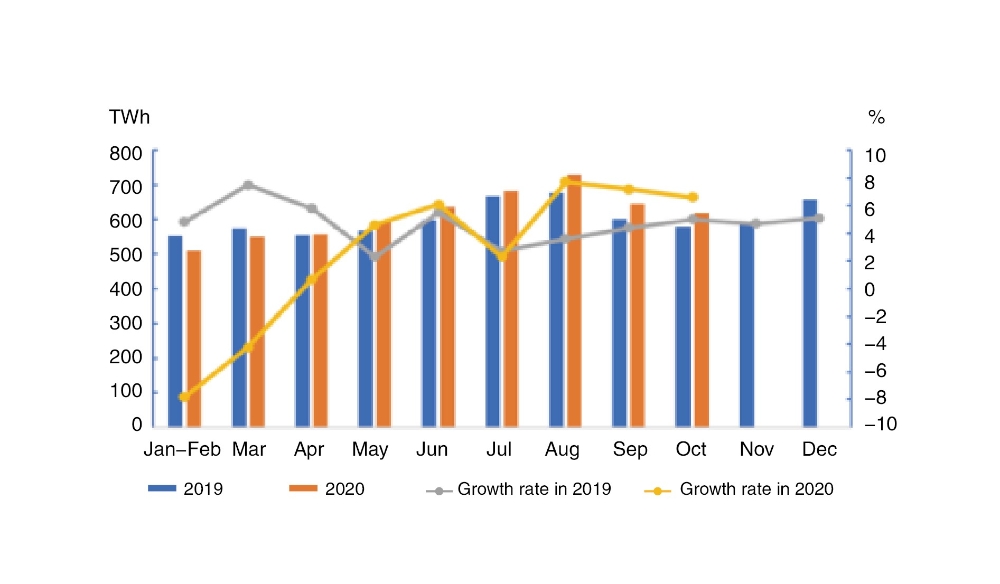
By sectors, from January to October, the electricity consumption of the primary industry was 71.0 TWh, an increase of 9.7% year-on-year; the electricity consumption of the secondary industry was 4034.0 TWh, a year-on-year increase of 1.2%; and the electricity consumption of the tertiary industry was 995.8 TWh, a year-on-year increase of 0.2%; and that of residential was 929.8 TWh, with a year-on-year increase of 5.9%.
In October, the electricity consumption of the primary, secondary and tertiary industries increased by 10.9%, 7.7% and 3.9% year-on-year respectively; and the residential electricity consumption increased by 4.0% year-on-year.
2. Electricity consumption by regions
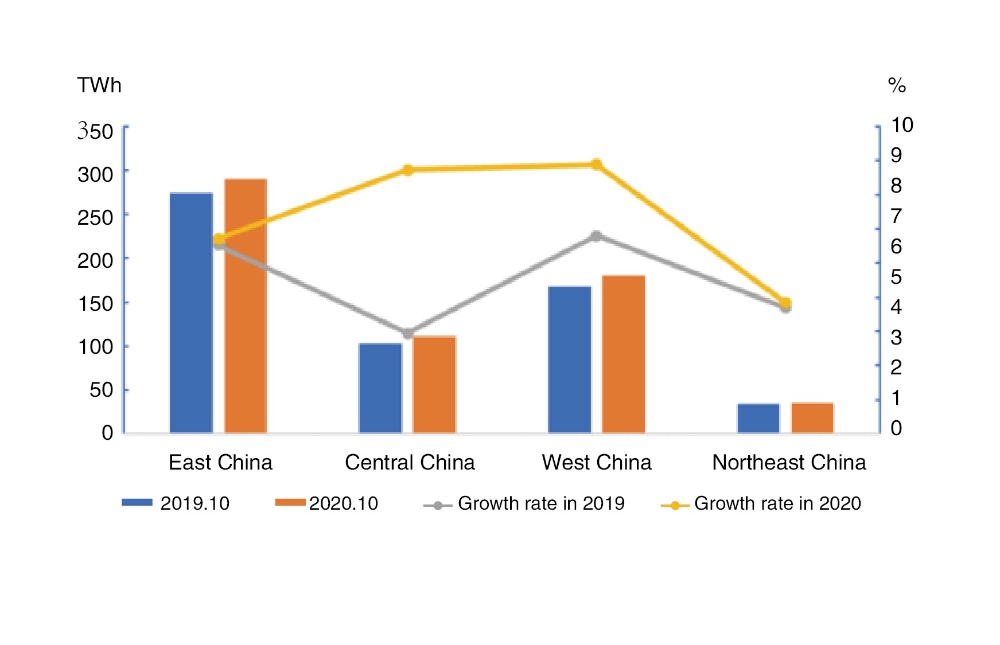
From January to October, the electricity consumption of the Eastern, Central, Western and Northeast China was 2853.7 TWh, 1127.4 TWh, 1706.7 TWh and 342.8 TWh respectively, with year-on-year growth rates of 0.9%, 0.3%, 4.6% and 1.0% respectively.
In October, the growth rates of the electricity consumption in the Eastern, Central, Western and Northeast regions were 5.7%, 7.7%, 7.9% and 3.8% respectively, among which the growth rates of West and Northeast regions were 1.9 and 1.0 percentage points higher than those of the previous month respectively, while the growth rates of Eastern and central regions were 2.0 and 1.4 percentage points lower than those of the previous month respectively.
From January to October, the year-on-year growth of electricity consumption in 16 provinces exceeded the national average, Namely, Yunnan (10.3%), Sichuan (6.8%), Gansu (6.6%), Inner Mongolia (6.3%), Tibet (5.8%),Guangxi (5.4%), Xinjiang (4.2%),Jiangxi (4.0%), Anhui (3.4%), Jilin(3.0%), Qinghai (2.7%), Fujian(2.4%), Guizhou(2.2%),Shanxi(2.1%), Guangdong(2.1%), and Shaanxi (1.4%).
In October, the growth rate of the electricity consumption in 13 provinces exceeded the national average, namely, Yunnan (18.7%), Sichuan (16.6%), Hebei (13.5%), Shanxi (11.9%),Henan(10.5%), Anhui (10.4%), Shandong (9.6%), Zhejiang(8.3%), Tibet (7.5%), Hubei(7.3%), Guizhou(7.1%), Inner Mongolia (6.8%), and Gansu(6.7%). There are 2 provinces with a negative growth rate of electricity consumption, Hainan(-2.5%) and Guangdong(-0.3%).
3、 Electricity consumption in industry and manufacturing
From January to October, the national industrial electricity consumption was 3960.4 TWh, a year-on-year increase of 1.2%, and the growth rate fell by 1.6 percentage points over the same period of the previous year, accounting for 65.7% of the total electricity consumption. In October, the national industrial electricity consumption was 423.9 TWh, an increase of 7.6% year-on-year, and the growth rate increased by 4.4 percentage points from the same period of the previous year, accounting for 68.7% of the total electricity consumption.
From January to October, the electricity consumption of the manufacturing industry was 3010.8 TWh, a year-on-year increaqse of 1.7%, and the growth rate fell by 1.3 percentage points over the same period of the previous year. Among them, the electricity consumption of the four energy-intensive industries totaled 1671.5 TWh, an increase of 2.6% year-on-year, and the growth rate raised by 0.3 percentage points from the same period of the previous year. The electricity consumption of the high-tech and equipment manufacturing industry was 619.6 TWh, an increase of 2.2% year-on-year, and the growth rate fell by 1.5 percentage points from the same period of the previous year. The electricity consumption of consumer goods manufacturing industry was 395.9TWh, a decrease of 3.2% year-on-year, and the growth rate fell by 5.2 percentage points from the same period of the previous year. The electricity consumption of other manufacturing industries was 323.8 TWh, a year-on-year increase of 2.3%, and the growth rate dropped by 4.1 percentage points over the same period of the previous year.
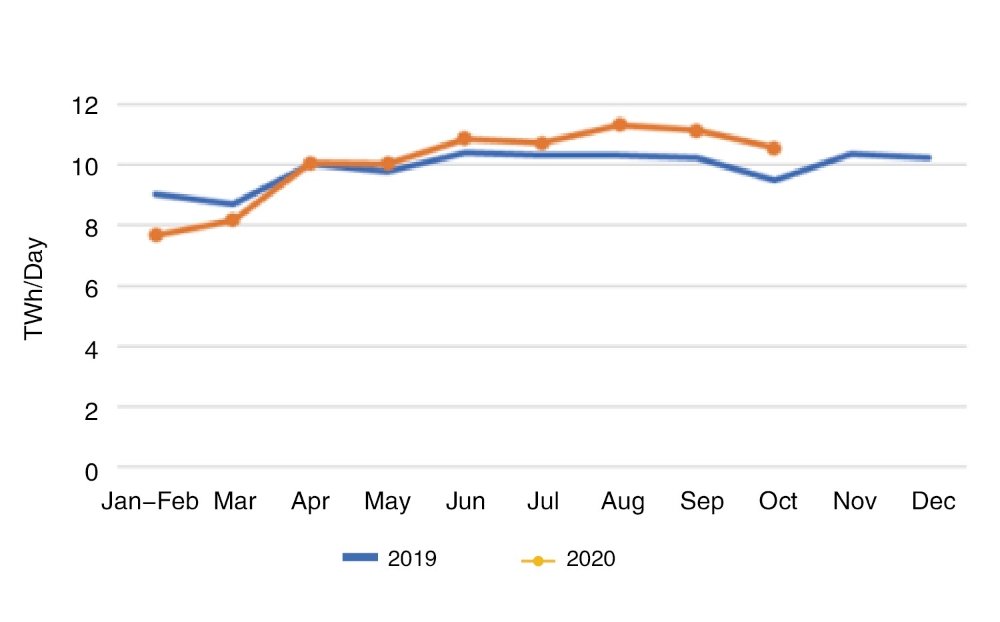
In October, the electricity consumption of the manufacturing industry was 327.1 TWh, an increase of 10.9% year-on-year, and the growth rate was 9.2 percentage points higher than the same period of the previous year. The average daily electricity consumption of the manufacturing industry was 10.55 TWh, an increase of 1.04 TWh from the same period of the previous year, and a decrease of 0.58 TWh from the previous month. Among them, the electricity consumption of the four energy-intensive industries totaled 181.2TWh, an increase of 11.4% year-on-year, and the growth rate increase by 13.3 percentage points from the same period of the previous year. The electricity consumption of the high-tech and equipment manufacturing industry was 66.1 TWh, an increase of 12.4% year-on-year, and the growth rate was 6.3 percentage points higher than the same period of the previous year. The electricity consumption of consumer goods manufacturing industry was 44.3 TWh, an increase of 7.1% year-on-year, and an increase of 2.2 percentage points from the same period of the previous year. The electricity consumption of other manufacturing industries was 35.6 TWh, a year-on-year increase 10.3%, and an increase of 1.5 percentage points over the same period of the previous year.
4. Electricity consumption in energy-intensive industries
From January to October, the electricity consumption of the chemical industry was 371.2 TWh, a increase of 0.4% year-on-year, and the growth rate raised by 0.2 percentage points from the same period of the previous year. The electricity consumption of the building materials industry was 310.0 TWh, an increase of 2.5% year-on-year, and the growth rate dropped by 2.6 percentage points from the same period of the previous year. The electricity consumption of the ferrous metal smelting and refining industry was 485.8 TWh, an increase of 3.2% year-on-year, and the growth rate was 2.2 percentage points lower than the same period of the previous year. The electricity consumption of the non-ferrous metal smelting and refining industry was 504.6 TWh, an increase of 3.7% year-on-year, and the increase rate was 4.3 percentage points higher than the same period of the previous year.
In October, the electricity consumption of the chemical industry was 39.7 TWh, an increase of 9.6% year-on-year, and the growth rate was 14.7 percentage points higher than the same period of the previous year. The electricity consumption of the building materials industry was 37.2 TWh, an increase of 15.7% year-on-year, and the growth rate was 16.2 percentage points higher than the same period of the previous year. The electricity consumption of the ferrous metal smelting and refining industry was 52.8 TWh, an increase of 12.5% year-on-year, and the growth rate increase by 9.6 percentage points over the same period of the previous year. The electricity consumption of the non-ferrous metal smelting and refining industry was 51.5 TWh, an increase of 8.9% year-on-year, and the growth rate was 13.7 percentage points higher than the same period of the previous year.
Tel:+86-25-84152563
Fax:+86-25-52146294
Email:export@hbtianrui.com
Address:Head Office: No.8 Chuangye Avenue, Economic Development Zone, Tianmen City, Hubei Province, China (Zip Code: 431700) Nanjing Office: Building 23, Baijiahu Science and Technology Industrial Park, No.2 Qingshuiting West Road, Jiangning Economic Development Zone, Nanjing City, Jiangsu Province,China (Zip Code:211106)