from:China Electricity Councildate:2021-06-06
From January to April 2021, the overall electricity consumption and the electricity consumption of three industries increased rapidly year-on-year. Electricity consumption growth in 13 provinces exceeded the national average. The YoY growth of electricity consumption in industrial and manufacturing sectors are both higher than the overall electricity consumption growth. The four energy-intensive industries see double-digit growth in electricity consumption.
1. Overall electricity consumption
From January to April, the overall electricity consumption reached 2,558.1TWh, increased YoY by 19.1%, in which monthly consumption in April was 636.1TWh, grew by 13.2%.
By sectors, from January to April, the electricity consumption of the primary industry was 28.3TWh, increased by 23.8%; the electricity consumption of the secondary industry was 1,707.4TWh, a YoY increase of 20.7%; and the electricity consumption of the tertiary industry was 437.9TWh, an increase of 29.0%; and that of residential was 384.5TWh, increased by 3.8%.
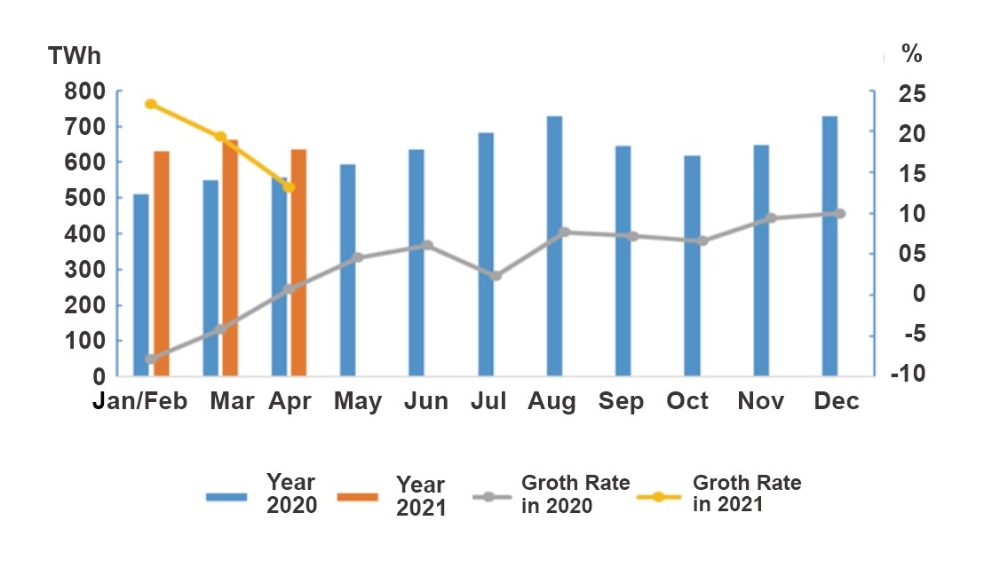
Figure 1: Electricity Consumption and Its Growth Rate by Month in 2020 and 2021
In April, the electricity consumption of primary, secondary and tertiary industries grew by 16.4%, 12.3% and 31.3% respectively, while residential electricity consumption fell by 0.9% year on year.
2. Electricity consumption by region
From January to April, the electricity consumption of the Eastern, Central, Western and Northeastern China was 1,187.1TWh, 479.1TWh, 741.0TWh and 151.0TWh respectively, grew year-on-year by 21.8%, 19.8%, 16.6% and 9.5% respectively.
In April, the electricity consumption of the Eastern, Central, Western and Northeastern China grew by 14.7%, 12.6%, 12.4% and 6.6% respectively.
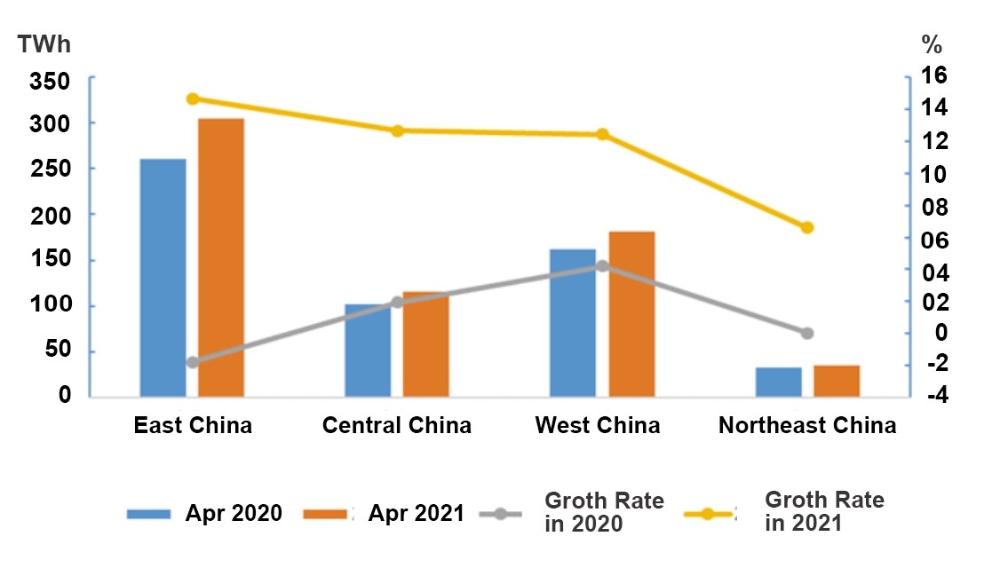
Figure 2: Electricity Consumption and its Growth Rate in April by Region
From January to April, electricity consumption growth in 13 provinces exceeded the national average level, namely: Tiebt (33.6%), Hubei (31.9%), Zhejiang (29.3%), Guangdong (29.2%), Yunnan (27.1%), Jiangxi (24.9%), Jiangsu (24.1%), Fujian (23.3%), Guangxi (21.8%), Sichuan (21.8%), Chongqing (20.4%), Anhui (19.8%)and Shaanxi(19.4%).
In April alone, the year-on-year growth of electricity consumption in 15 provinces exceeded the national average, namely: Tibet (27.5%), Guangdong (22.6%), Ningxia (22.0%), Hubei (20.0%), Hainan (19.6%), Qinghai (19.3%), Yunnan (18.4%), Zhejiang (16.5%), Sichuan (16.3%), Fujian (16.1%), Jiangxi (15.6%), Jiangsu (15.1%), Guangxi (14.4%), Hebei (13.9%) and Shannxi (13.6%). Electricity consumption in all provinces has seen positive growth.
3. Electricity consumption in industrial and manufacturing sector
From January to April, the industrial electricity consumption nationwide reached 1,675.7TWh, a year-on-year increase of 20.5%, 26.6 percentage points higher than the growth of the same period of last year, accounting for 65.5% of the overall electricity consumption. In April, the national industrial electricity consumption was 437.1TWh, a year-on-year increase of 12.1%, which was 10.7 percentage points higher compared to last year, accounting for 68.7% of the monthly electricity consumption.
From January to April, the electricity consumption of the manufacturing industry was 1276.5TWh, a year-on-year increase of 22.5%, 29 percentage points higher compared to the growth of same period of the previous year. Among them, the electricity consumption of the four energy-intensive industries totaled at 705.9TWh, increased by 16.3% year-on-year, with the growth rate raised by 19.4 percentage points from the same period of the previous year. The electricity consumption of the high-tech and equipment manufacturing industry was 267.0TWh, an increase of 35.9% year-on-year, 46.8 percentage points higher compared with the same period of the previous year. Electricity consumption of consumer goods manufacturing industry was 165.2TWh, an increase of 27.5% year-on-year, 41.8 percentage points higher than the previous year. Electricity consumption in other manufacturing industries was 138.5TWh, a year-on-year increase of 26.5%, grew by 32.9 percentage points.
In April, electricity consumption of the manufacturing industry was 344.1TWh, a year-on-year increase of 12.7%, grew by 12.6 percentage points over the same period of the previous year. Moreover, its average daily electricity consumption reached 11.47TWh, up by 14.3TWh/day over the same period of last year. Among them, electricity consumption of the four energy-intensive industries totaled at 186.9TWh, increased by 10.0%, with its growth rate raised by 8.5 percentage points from the same period of the previous year. The electricity consumption of the high-tech and equipment manufacturing industries was 73.5TWh, an increase of 18.7% year-on-year, 18.8 percentage points higher than the same period of the previous year. Electricity consumption of consumer goods manufacturing industry was 46.2TWh, an increase of 12.4%, with its growth rate rose by 16.6 percentage points. The electricity consumption of other manufacturing industries was 37.5TWh, a year-on-year increase of 16.3%, which was 16.7 percentage points higher over the same period of the previous year.
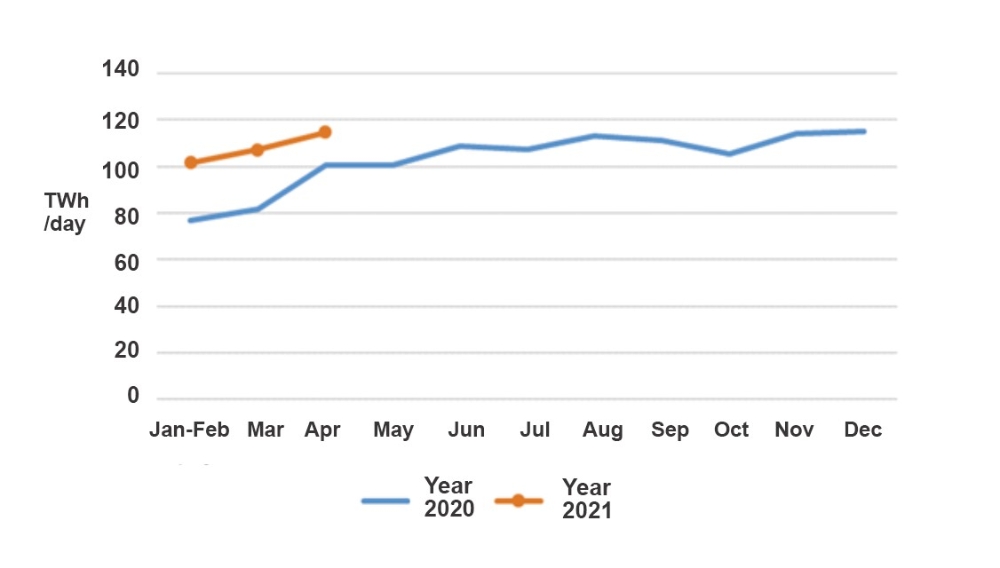
Figure 3: Average Daily Electricity Consumption of Manufacturing by Month in 2020 and 2021
4. Electricity consumption in energy-intensive industries
From January to April, the electricity consumption of the chemical industry was 161.6TWh, an increase of 12.3% year-on-year, and the growth rate raised by 16.5 percentage points from the same period of the previous year. The electricity consumption of the building materials industry was 118.2TWh, increased by 30.6% year-on-year, 43.2 percentage points higher over the same period of the previous year. The electricity consumption of the ferrous metal smelting and refining industry was 206.9TWh, an increase of 19.4% year-on-year, which was 21.4 percentage points higher than the same period of the previous year. The electricity consumption of non-ferrous metal smelting and refining industry was 219.1TWh, grew by 10.1%, and the growth rate was 8.3 percentage points higher than the same period of the previous year.
In April, the electricity consumption of the chemical industry was 40.2TWh, increased by 7.3% year-on-year, with its growth rate raised by 7.1 percentage points compared to the same period of the previous year. The electricity consumption of the building materials industry was 37.7TWh, an increase of 14.6%, increased by 15.7 percentage points over the same period of the previous year. Electricity consumption of ferrous metal smelting and refining industry was 53.9TWh, an increase of 15.1% year-on-year, 14.4 percentage points higher than the same period of the previous year. The electricity consumption of the non-ferrous metal smelting and refining industry was 55.2TWh, an increase of 4.4% year-on-year, grew by 0.4 percentage points.
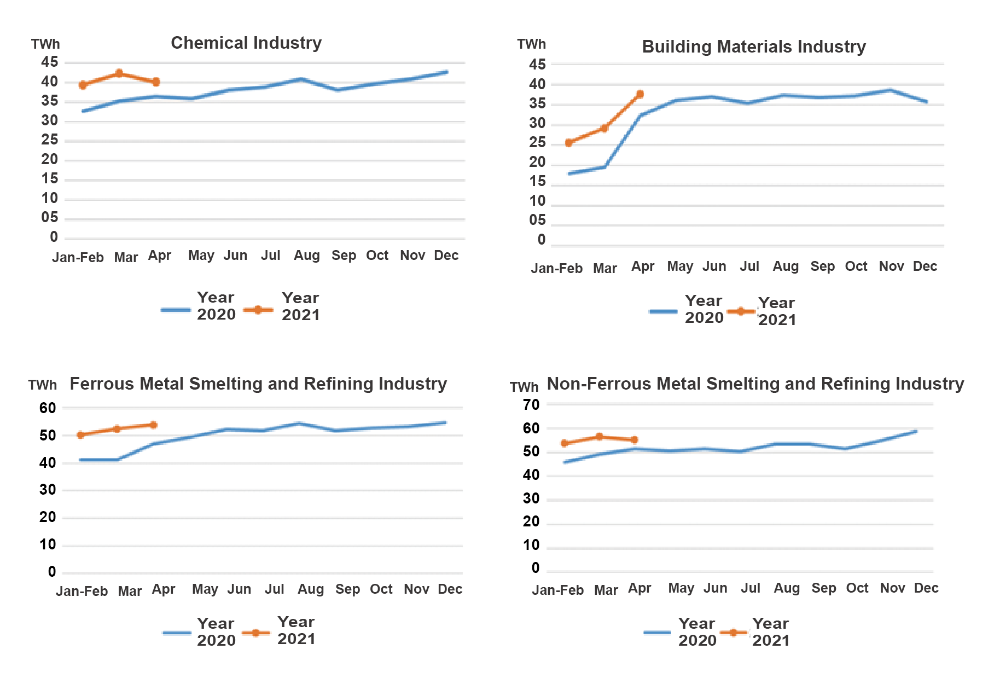
Figure 4: Monthly Electricity Consumption of Key Industries in 2020 and 2021
Tel:+86-25-84152563
Fax:+86-25-52146294
Email:export@hbtianrui.com
Address:Head Office: No.8 Chuangye Avenue, Economic Development Zone, Tianmen City, Hubei Province, China (Zip Code: 431700) Nanjing Office: Building 23, Baijiahu Science and Technology Industrial Park, No.2 Qingshuiting West Road, Jiangning Economic Development Zone, Nanjing City, Jiangsu Province,China (Zip Code:211106)