from:China Electricity Councildate:2021-06-23
From January to May 2021, the overall electricity consumption and the electricity consumption of three industries maintained double-digits growth year-on-year. Electricity consumption growth in 14 provinces exceeded the national average. The YoY growth of electricity consumption in industrial and manufacturing sectors are both higher than the overall electricity consumption growth. The total growth rate of power consumption of the four energy-intensive industries increased year on year.
1. Overall electricity consumption
From January to May , the overall electricity consumption reached 3,230.5TWh, increased YoY by 17.7%, in which monthly consumption in May was 672.4TWh, grew by 12.5%.
By sectors, from January to May, the electricity consumption of the primary industry was 36.2TWh, increased by 21.6%; the electricity consumption of the secondary industry was 2,177.9TWh, a YoY increase of 18.6%; and the electricity consumption of the tertiary industry was 548.3TWh, an increase of 27.8%; and that of residential was 468.1TWh, increased by 4.1%.
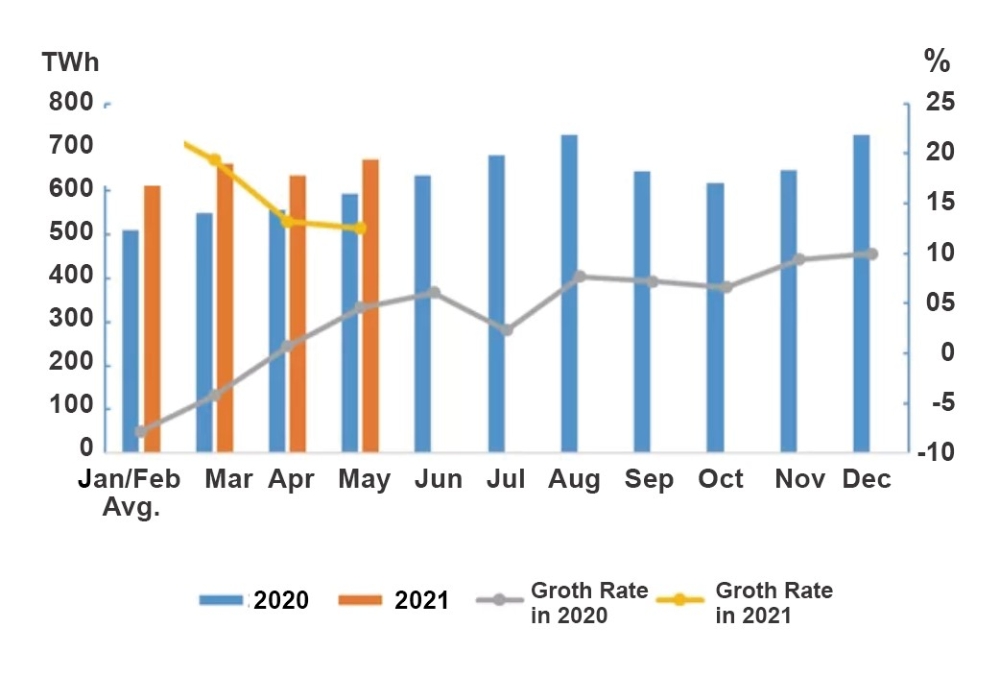
Figure 1: Electricity Consumption and Its Growth Rate by Month in 2020 and 2021
In May, the electricity consumption of primary, secondary and tertiary industries grew by 13.9%, 11.5% and 23.4% respectively, while residential electricity consumption increase 5.6% year on year.
2. Electricity consumption by region
From January to May, the electricity consumption of the Eastern, Central, Western and Northeastern China was 1,516.4TWh, 598.8TWh, 928.1TWh and 187.3TWh respectively, grew year-on-year by 20.1%, 17.6%, 15.7% and 9.7% respectively.
In May, the electricity consumption of the Eastern, Central, Western and Northeastern China grew by 14.1%, 9.5%, 12.2% and 10.7% respectively.
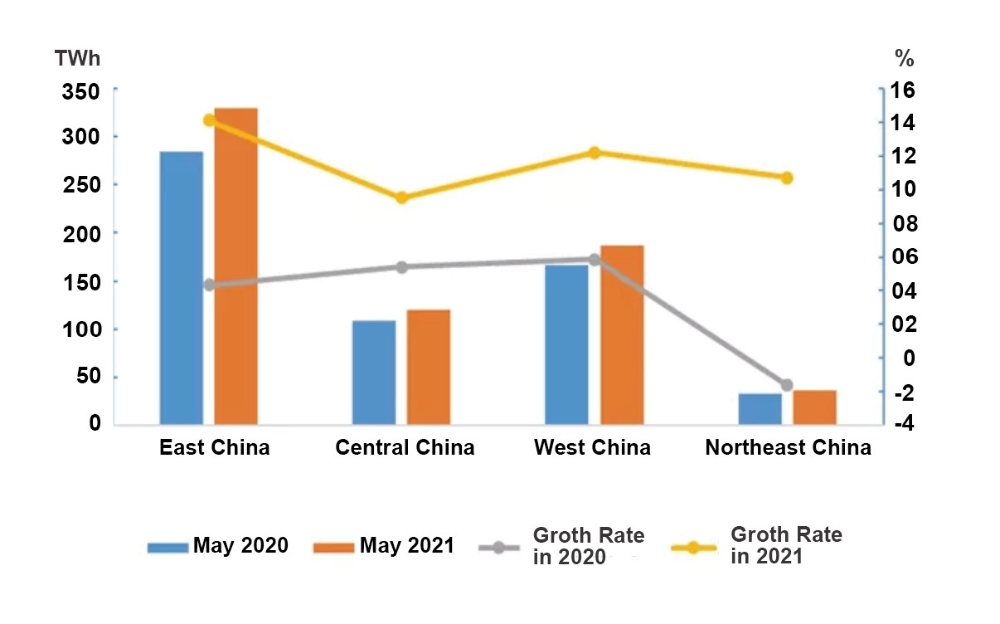
Figure 2: Electricity Consumption and its Growth Rate in April by Region
From January to May, electricity consumption growth in 14 provinces exceeded the national average level, namely: Tibet (32.7%), Hubei (27.1%), Guangdong (27.0%), Zhejiang (26.4%), Yunnan (23.3%), Fujian (22.8%), Jiangxi (21.9%), Jiangsu (21.7%), Sichuan (19.9%), Guangxi (19.4%), Shaanxi (18.8%), Qinghai (18.7%), Ningxia (18.3%), and Chongqing (18.3%).
In May alone, the year-on-year growth of electricity consumption in 15 provinces exceeded the national average, namely: Tibet (29.2%), Ningxia (24.7%), Qinghai (22.7%), Fujian (21.4%), Guangdong (21.2%), Xinjiang (17.2%), Zhejiang (17.0%), Shaanxi (16.1%), Hainan (15.4%), Shanxi (13.6%), Jiangsu (13.4%), Hunan (13.1%), Sichuan (13.0%) and Gansu (12.6%); the electricity consumption in all provinces showed positive growth.
3. Electricity consumption in industrial and manufacturing sector
From January to May, the industrial electricity consumption nationwide reached 2,138.1TWh, a year-on-year increase of 18.5%, 22.4 percentage points higher than the growth of the same period of last year, accounting for 66.2% of the overall electricity consumption. In May, the national industrial electricity consumption was 462.4TWh, a year-on-year increase of 11.6%, which was 8.8 percentage points higher compared to last year, accounting for 68.8% of the monthly electricity consumption.
From January to May the electricity consumption of the manufacturing industry was 1,636.2TWh, a year-on-year increase of 20.5%, 25.2 percentage points higher compared to the growth of same period of the previous year. Among them, the electricity consumption of the four energy-intensive industries totaled at 902.9TWh, increased by 15.4% year-on-year, with the growth rate raised by 17.5 percentage points from the same period of the previous year. The electricity consumption of the high-tech and equipment manufacturing industry was 342.9TWh, an increase of 31.0% year-on-year,38.3 percentage points higher compared with the same period of the previous year. Electricity consumption of consumer goods manufacturing industry was 213.0TWh, an increase of 24.6% year-on-year,36.4 percentage points higher than the previous year. Electricity consumption in other manufacturing industries was 177.4TWh, a year-on-year increase of 24.0%, grew by 28.2 percentage points.
In May, electricity consumption of the manufacturing industry was 359.5TWh, a year-on-year increase of 13.7%, grew by 11.2percentage points over the same period of the previous year. Moreover, its average daily electricity consumption reached 116.0TWh, up by 15.5TWh/day over the same period of last year. Among them, electricity consumption of the four energy-intensive industries totaled at 197.0TWh, increased by 12.2%, with its growth rate raised by 10.0 percentage points from the same period of the previous year. The electricity consumption of the high-tech and equipment manufacturing industries was 75.9TWh, an increase of 15.9% year-on-year, 10.5 percentage points higher than the same period of the previous year. Electricity consumption of consumer goods manufacturing industry was 47.7TWh, an increase of 14.8%, with its growth rate rose by 16.5 percentage points. The electricity consumption of other manufacturing industries was 38.9TWh, a year-on-year increase of 16.1%, which was 11.8 percentage points higher over the same period of the previous year.
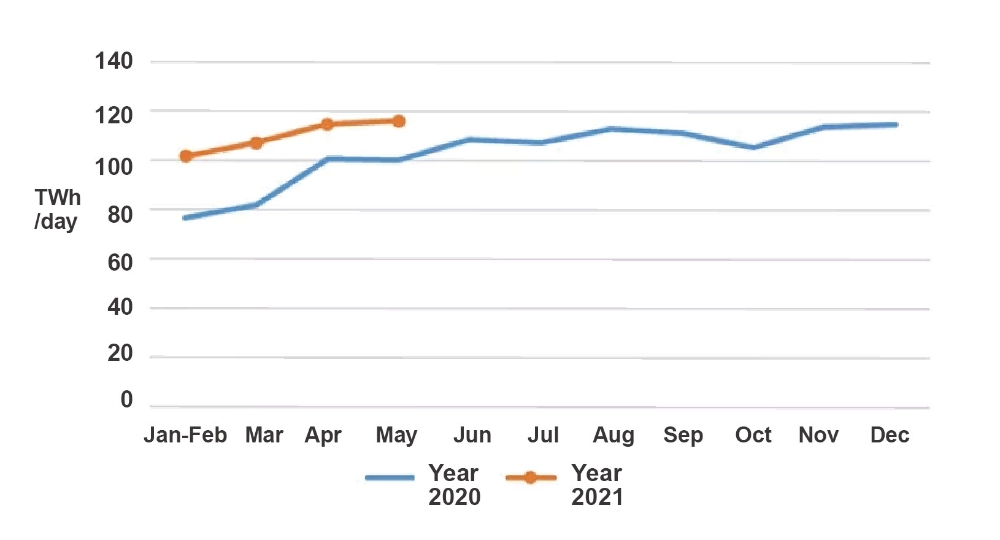
Figure 3: Average Daily Electricity Consumption of Manufacturing by Month in 2020 and 2021
4. Electricity consumption in energy-intensive industries
From January to May, the electricity consumption of the chemical industry was 204.8TWh, an increase of 12.8% year-on-year, and the growth rate raised by 17.0 percentage points from the same period of the previous year. The electricity consumption of the building materials industry was 158.0TWh, increased by 24.4% year-on-year, 31.8 percentage points higher over the same period of the previous year. The electricity consumption of the ferrous metal smelting and refining industry was 263.9TWh, an increase of 18.3% year-on-year, which was 19.8 percentage points higher than the same period of the previous year. The electricity consumption of non-ferrous metal smelting and refining industry was 276.3TWh, grew by 10.2%, and the growth rate was 8.2 percentage points higher than the same period of the previous year.
In May, the electricity consumption of the chemical industry was 43.1TWh, increased by 14.8% year-on-year, with its growth rate raised by 16.9 percentage points compared to the same period of the previous year. The electricity consumption of the building materials industry was 39.8TWh, an increase of 9.0%, increased by 2.5 percentage points over the same period of the previous year. Electricity consumption of ferrous metal smelting and refining industry was 56.9TWh, an increase of 14.6% year-on-year, 12.5 percentage points higher than the same period of the previous year. The electricity consumption of the non-ferrous metal smelting and refining industry was 57.2TWh, an increase of 10.4% year-on-year, grew by 7.7 percentage points.
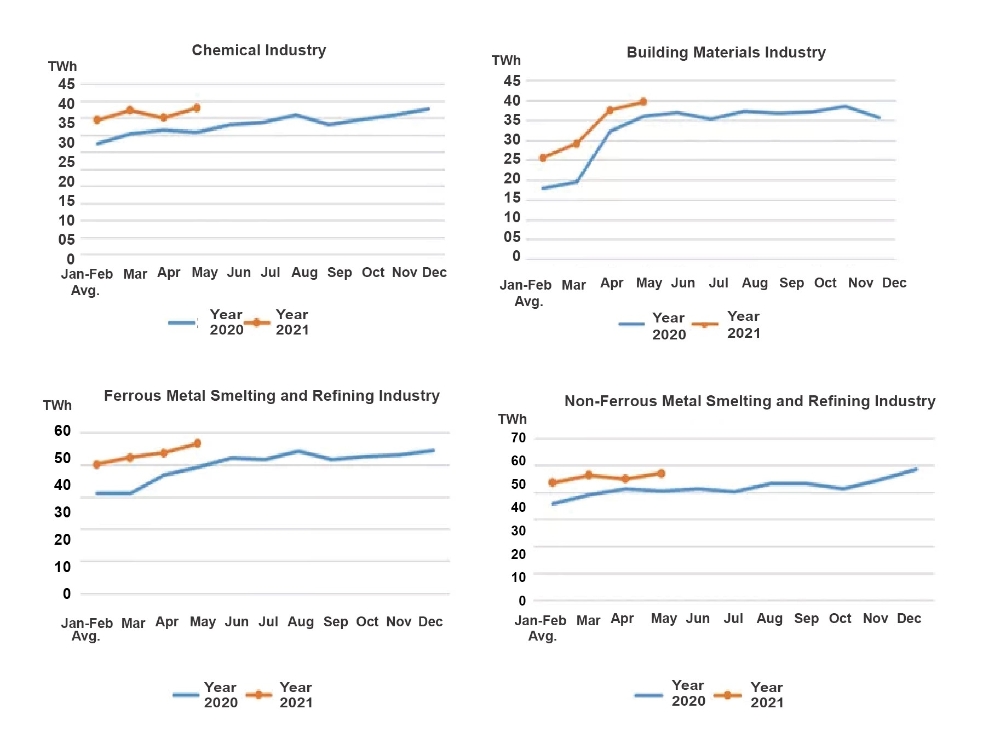
Figure 4: Monthly Electricity Consumption of Key Industries in 2020 and 2021
Tel:+86-25-84152563
Fax:+86-25-52146294
Email:export@hbtianrui.com
Address:Head Office: No.8 Chuangye Avenue, Economic Development Zone, Tianmen City, Hubei Province, China (Zip Code: 431700) Nanjing Office: Building 23, Baijiahu Science and Technology Industrial Park, No.2 Qingshuiting West Road, Jiangning Economic Development Zone, Nanjing City, Jiangsu Province,China (Zip Code:211106)